sre guides

2 posts

One of the most common reasons why monitoring servers (Prometheus, VictoriaMetrics, Grafana Mimir) crash with OOM (Out Of Memory) errors is **high cardinality**. This refers to a scenario where one or more metrics contain labels with too many unique values, or when these values change at a very high rate (known as Label Churn Rate).
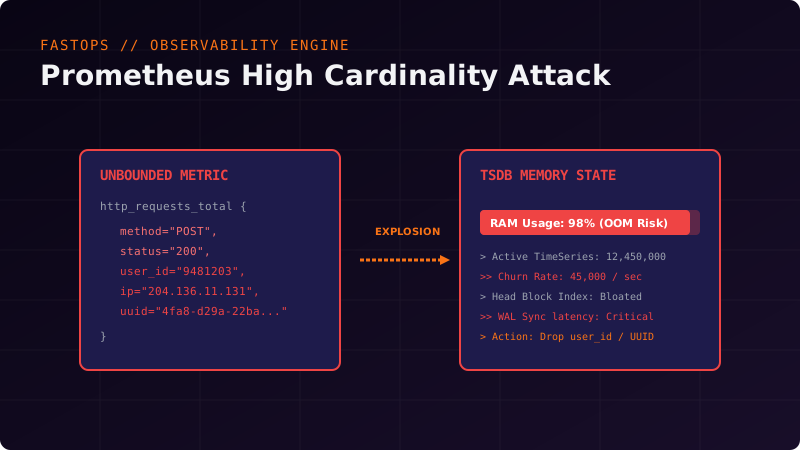
Tackling High Metric Cardinality in Prometheus and VictoriaMetrics
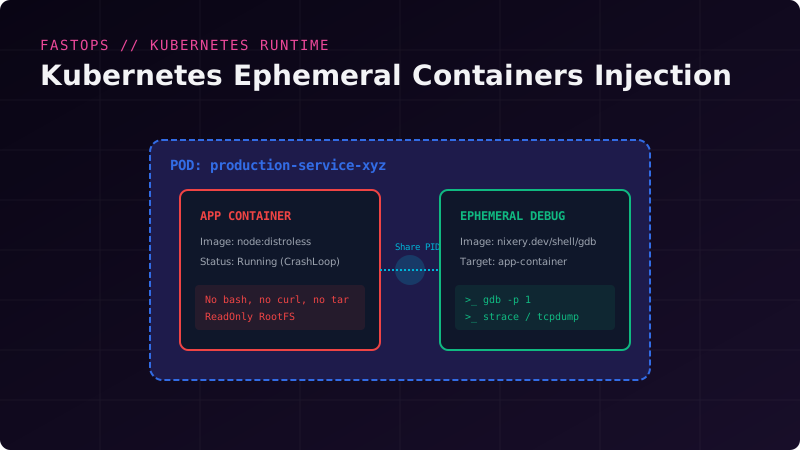
In modern DevOps and SRE practices, using minimalist base container images—such as Google's **Distroless** or completely empty **scratch** images—has become the standard for security and performance. These images lack command shells (`bash`, `sh`), system package managers (`apt`, `apk`), debugging utilities (`curl`, `wget`, `tcpdump`, `strace`), and even basic utilities like `ls` or `cat`.
Debugging Distributed Applications in Kubernetes via Ephemeral Containers