Posts tagged with #prometheus

2 posts

In the rapidly evolving landscape of modern systems and digital applications, achieving top-tier performance, security, and scalability is no longer optional. This article provides a comprehensive, technically rigorous analysis of current industry standards, exploring architectural paradigms, concrete code patterns, and practical execution checklists to harden and optimize your production systems.

Scaling Prometheus for High-Throughput Metrics with Thanos
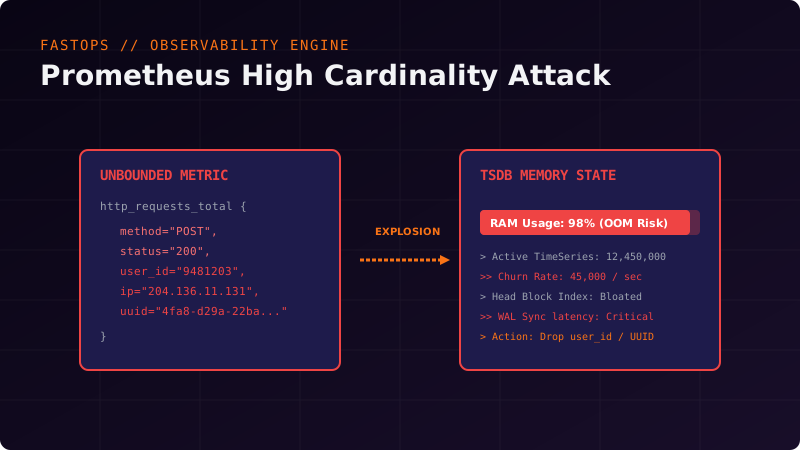
One of the most common reasons why monitoring servers (Prometheus, VictoriaMetrics, Grafana Mimir) crash with OOM (Out Of Memory) errors is **high cardinality**. This refers to a scenario where one or more metrics contain labels with too many unique values, or when these values change at a very high rate (known as Label Churn Rate).
Tackling High Metric Cardinality in Prometheus and VictoriaMetrics